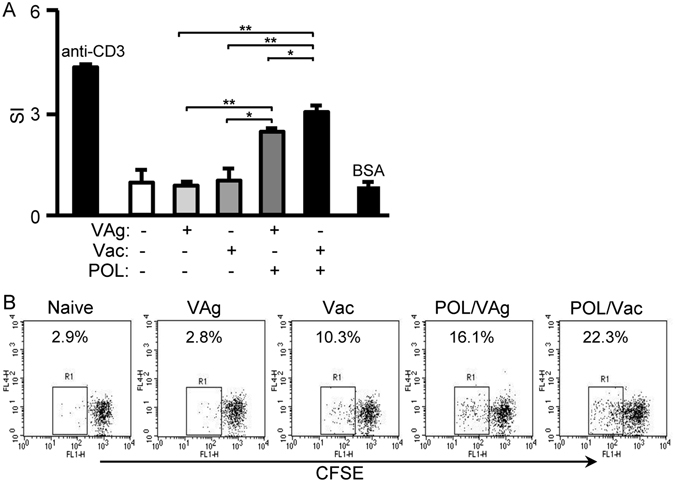
Figure 1.

POL stimulated HBV specific T cell response in C57BL/6 mice. (A) 4 days after the 3rd vaccination, the splenocytes of immunized mice were prepared. T cell proliferation was analyzed by the MTT method and expressed as SI. The anti-CD3 mAb was used as positive control while BSA was used as non-specific control. (B) 4 days after the 3rd vaccination, the splenocytes of immunized mice were prepared. T cell proliferation was analyzed by CFSE staining method and the proliferative cells were analyzed. The anti-CD3 mAb was used as positive control. Shown in each panel is 1 of at least 3 experiments with similar results. Bar, mean and SD from 3 independent experiments, each using at least three mice per group (n = 3); *p < 0.05; **p < 0.01.
