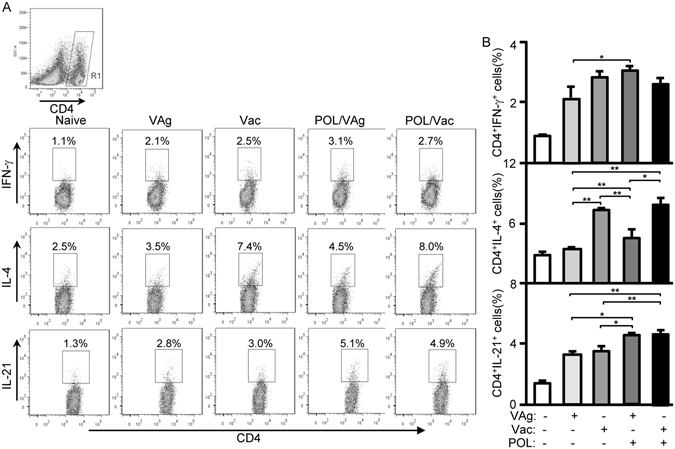
Figure 2.

Cytokine levels of CD4 T cells in immunized C57BL/6 mice. 4 days after the 3rd vaccination, the splenocytes of immunized C57BL/6 mice were prepared. For cytokines level in CD4 T cells analysis, the splenocytes were stimulated with Cell Stimulation Cocktail (eBioscience) and treated with Protein Transport Inhibitor Cocktail (eBioscience) for cytokines production by flow cytometry. (A) The samples were intracellularly stained with anti-mouse CD4-FITC/IFN-γ-PE for Th1 cytokine analysis, anti-mouse CD4-FITC/IL-4-PE for Th2 cytokine analysis or anti-mouse CD4-FITC/IL-21-PE for Tfh cytokine analysis. The CD4+IFN-γ+ cells, CD4+IL-4+cells or CD4+IL-21+ cells were counted relatively to total CD4+ T cells. (B) The statistical results of Th1, Th2 and Tfh cytokines were shown. Shown in each panel is 1 of at least 3 experiments with similar results. Bar, mean and SD from 3 independent experiments, each using at least three mice per group (n = 3); *p < 0.05; **p < 0.01.
