
Figure 1.
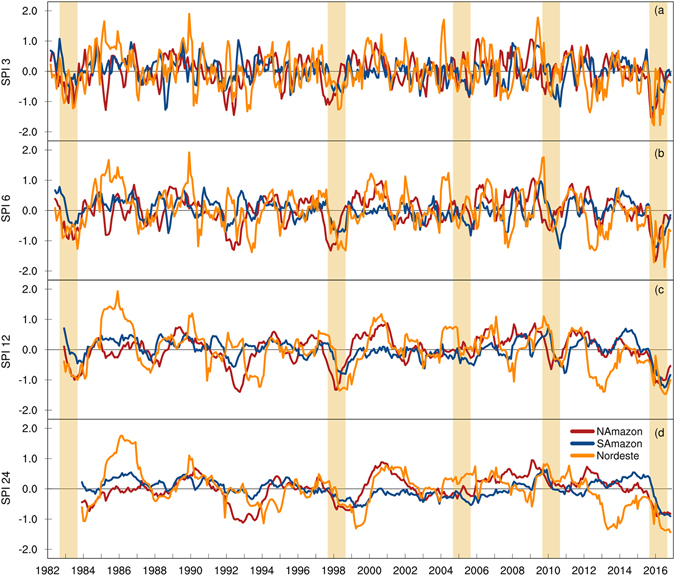
Time series of Standardized Precipitation Index (SPI). The entire Tropical/sub-Tropical South America is divided into South Amazon (SA), North Amazon (NA), and Nordeste (NORD) regions to construct the area-averaged time series (see Figure S1 for details). The 3, 6, 12, and 24-month SPIs shown in (a,b,c and d) respectively were calculated using the GPCC monthly precipitation data from 1982 to 2017. For all time scales, the 2016 SPIs over Nordeste and South Amazon are the largest seen in the analysis period. Figures created with: The NCAR Command Language (Version 6.3.0) [Software]. (2016). Boulder, Colorado: UCAR/NCAR/CISL/TDD. http://dx.doi.org/10.5065/D6WD3XH5.