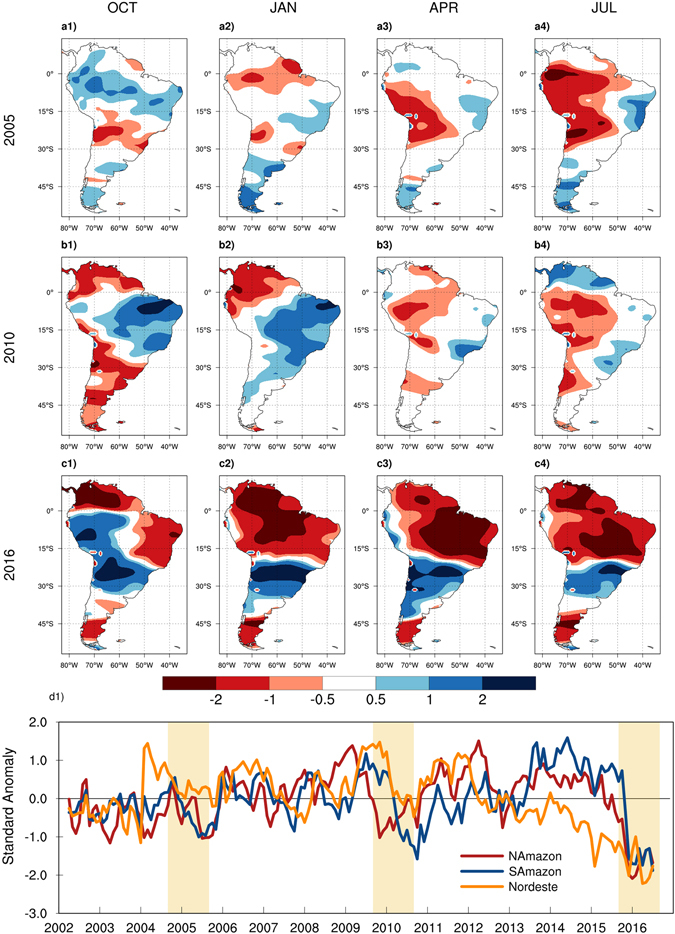
Figure 3.

Spatial maps and time series of TWS standardized anomalies calculated using GRACE data from 2002 to 2017. The contour plots present the seasonal anomalies for the three extreme droughts of 2005 (a1,a2,a3,a4), 2010 (b1,b2,b3,b4), and 2016 (c1,c2,c3,c4). The monthly time series (d1) were constructed by averaging anomalies over the North Amazon, South Amazon, and Nordeste regions and the highlight strips denote the extreme droughts represented in the spatial maps. Seasonal cycles for each year start from September of the previous year (e.g. SON 2004 for 2005 seasonal cycle). Figures created with: The NCAR Command Language (Version 6.3.0) [Software]. (2016). Boulder, Colorado: UCAR/NCAR/CISL/TDD. http://dx.doi.org/10.5065/D6WD3XH5.
