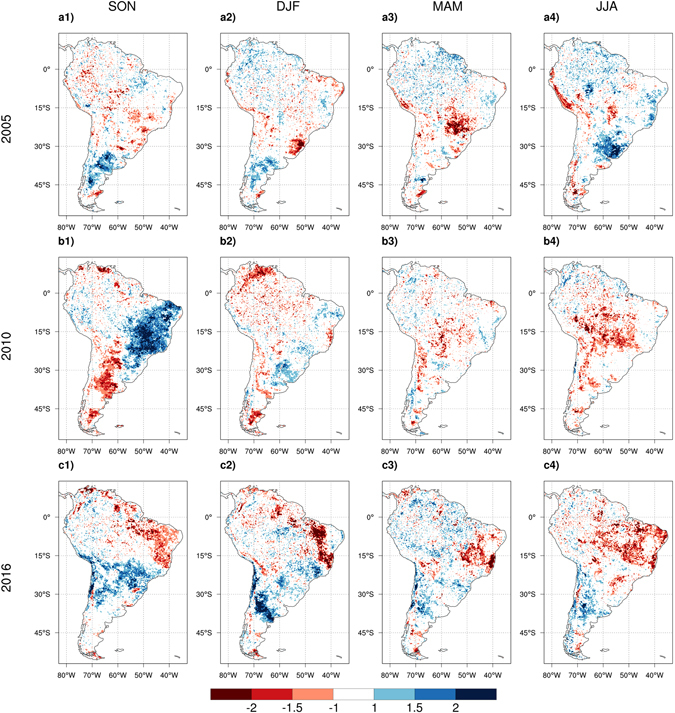
Figure 4.

Spatial maps of Normalized Difference Vegetation Index (NDVI) anomalies calculated using NASA MODIS product over 2003–2017. The seasonal anomalies are shown for the three extreme droughts of 2005 (a1,a2,a3,a4), 2010 (b1,b2,b3,b4), and 2016 (c1,c2,c3,c4). Seasonal cycles for each year start from September of the previous year (e.g. SON 2004 for 2005 seasonal cycle). Figures created with: The NCAR Command Language (Version 6.3.0) [Software]. (2016). Boulder, Colorado: UCAR/NCAR/CISL/TDD. http://dx.doi.org/10.5065/D6WD3XH5.
