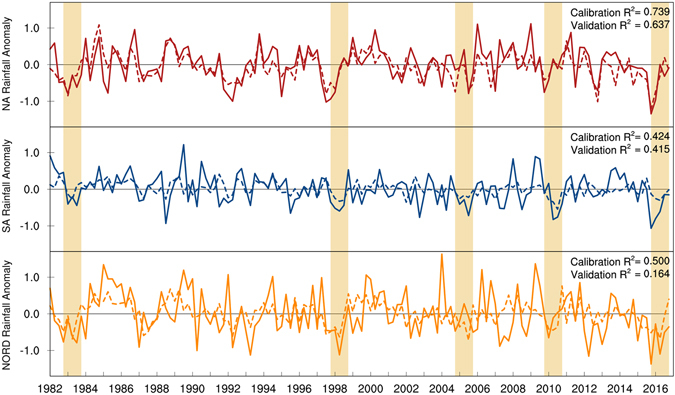
Figure 5.

Time series of the predicted (dashed lines) versus observed (solid lines) seasonal precipitation anomalies over North Amazon (top), South Amazon (middle), and Nordeste (bottom). The predicted and observed time series of rainfall deficits are used to calculate coefficient of determination (R2) for the calibration (1982–2001) and validation (2002–2017) periods. Compared to South Amazon and Nordeste, the predicted anomalies explain the rainfall variability better over North Amazon. The model prediction for 2016 rainfall deficits closely resemble the observations over North Amazon yet, substantially underestimate the deficits observed over South Amazon and Nordeste. Figures created with: The NCAR Command Language (Version 6.3.0) [Software]. (2016). Boulder, Colorado: UCAR/NCAR/CISL/TDD. http://dx.doi.org/10.5065/D6WD3XH5.
