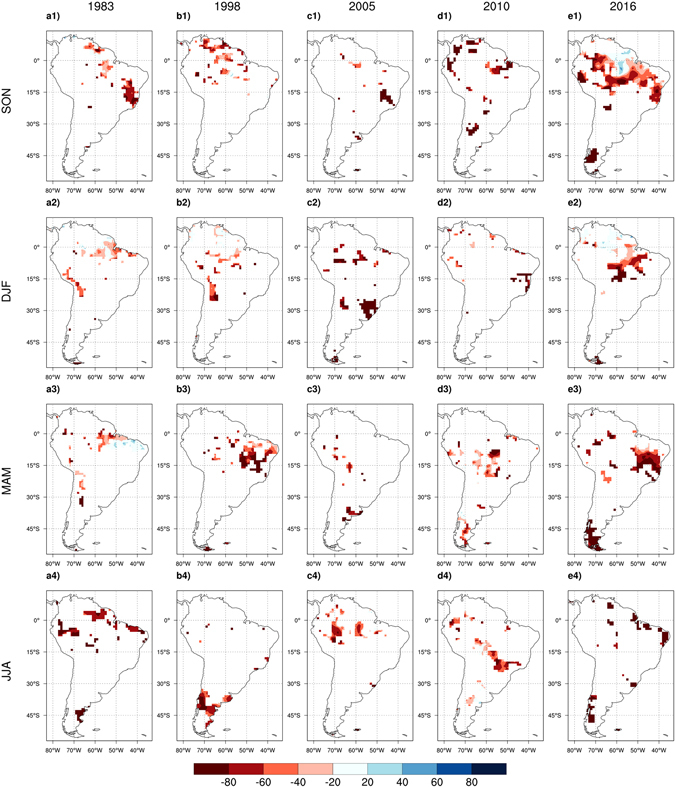
Figure 6.

Spatial maps of model relative biases in predicting the magnitude of precipitation anomalies for the five extreme droughts of 1983 (a1 to a4), 1998 (b1 to b4), 2005 (c1 to c4), 2010 (d1 to d4), and 2016 (e1 to e4). The areas where magnitude of the observed negative standardized anomalies of precipitation is lower than 1.0 are masked out in order to only focus on regions that experience intense drought. Here, the least-square fit is implemented over the entire analysis period (1982–2017) to equally account for all five extreme droughts when deriving the regression coefficients of the multivariate linear model. Seasonal cycles for each year start from September of the previous year (e.g. SON 2004 for 2005 seasonal cycle). Figures created with: The NCAR Command Language (Version 6.3.0) [Software]. (2016). Boulder, Colorado: UCAR/NCAR/CISL/TDD. http://dx.doi.org/10.5065/D6WD3XH5.
