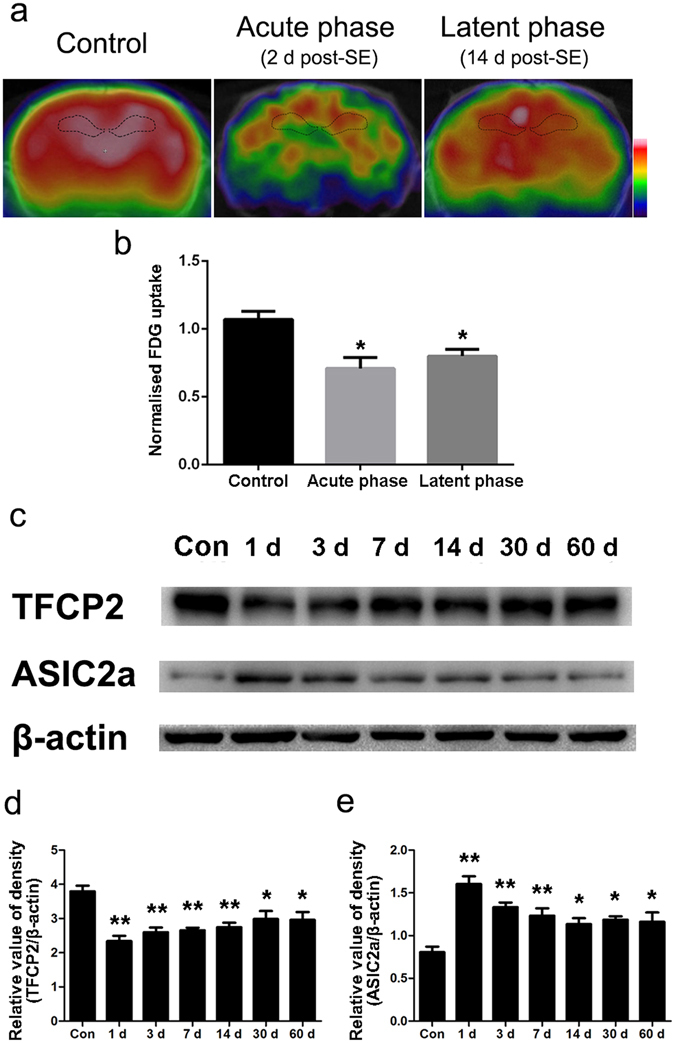
Figure 2.

Altered hippocampal TFCP2 and ASIC2a expression with glucose hypometabolism in pilocarpine-treated rats. (a) Representative coronal view microscopic positron emission tomography images in the different phases of epileptogenesis. (b) Hippocampal glucose uptake in the different phases after pilocarpine injection. (c) Representative western blot assays of hippocampal TFCP2 and ASIC2a expression at different post-seizure time points. (d) Bar graph showing decreased hippocampal TFCP2 expression in pilocarpine-treated rats. (e) Bar graph showing increased hippocampal ASIC2a expression in pilocarpine-treated rats. The experiments were repeated at least 3 times with at least 3 rats in each group. Data are presented as means ± standard errors and were analysed using 1-way ANOVA and Dunnett’s multiple comparisons test. *P < 0.05 compared with controls, **P < 0.01 compared with controls. Uncropped western blot images are shown in Supplementary Fig. 1. Abbreviations, ASIC2a: acid-sensing ion channel 2a; TFCP2: transcription factor CP2; SE: status epilepticus; Con: control.
