
Figure 3.
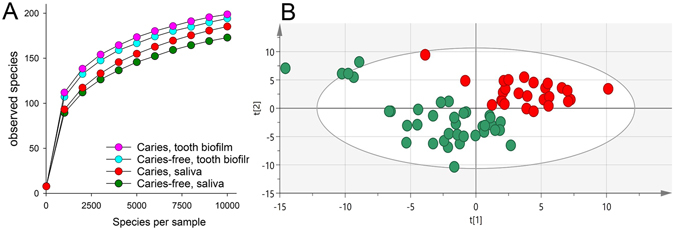
Species richness in saliva and tooth biofilm samples from 17-year old Swedish adolescents and subject clustering. (A) Rarefaction curves showing species richness based on number of species by species per sample in saliva and tooth biofilm samples. (B) Principal component analysis (PCA) scatter plot separating the caries-affected (red dots) from caries-free adolescents (green dots) based on microbial taxa detection in saliva and lifestyle confounders.