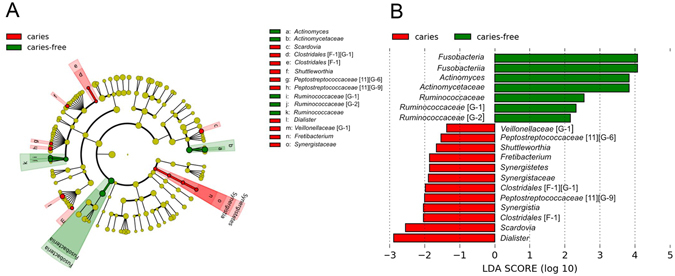
Figure 4.

LEfSe analysis of saliva microbiota in caries versus caries-free adolescents. (A) Cladogram generated by LEfSe indicating differences at phylum, class, family and genus levels between the two groups. Each successive circle represents a phylogenetic level. Regions in red indicate taxa enriched in caries affected while regions in green indicate taxa enriched in caries-free subjects. Differing taxa are listed on the right side of the cladogram. (B) Bar graph showing LDA scores.
