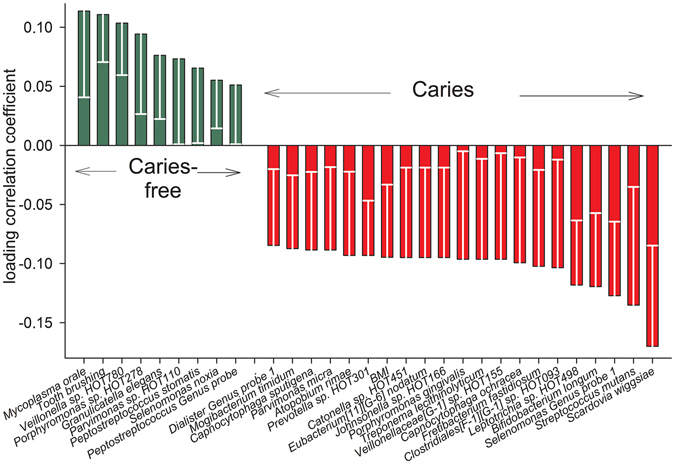
Figure 5.

PLS loading column plot. Mean (95% CI) PLS correlation coefficients for the top 20 taxa associated with having caries and all taxa associated with being caries-free. The PLS model included caries as dependent variable and saliva detected species level taxa, sex, BMI, oral hygiene, and sweet snacking, as the independent block. w describes the PLS weights from the combination of the original variables in the X-swarm and c the same for the Y-swarm. A variable is considered statistical significant when the 95% CI of the correlation coefficient does not include zero.
