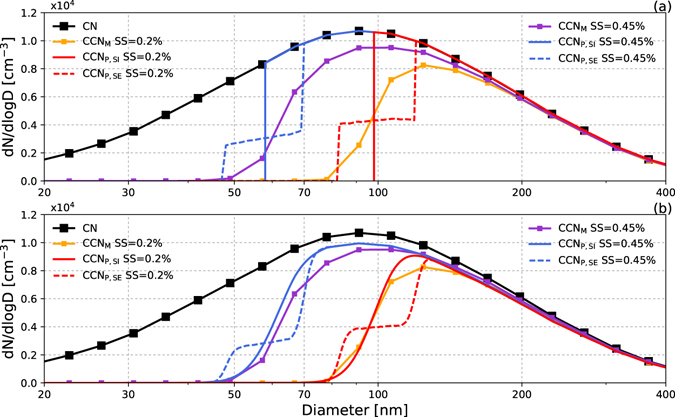
Figure 3.

Average CN, CCN number size distribution measured during the campaign and number size distribution of CCN predicted by (a) method 1 and (b) method 2. The black line is the campaign average CN number distribution; the yellow and purple lines are the measured averaged CCN number size distribution at 0.2 and 0.45% levels of supersaturation, respectively. The red and blue lines are the average predicted CCN number size distribution at 0.2 and 0.45% levels of supersaturation and the solid and dashed lines represent predictions with assumptions of internal and external mixing, respectively. The diamond data points are the median values of all measured spectra.
