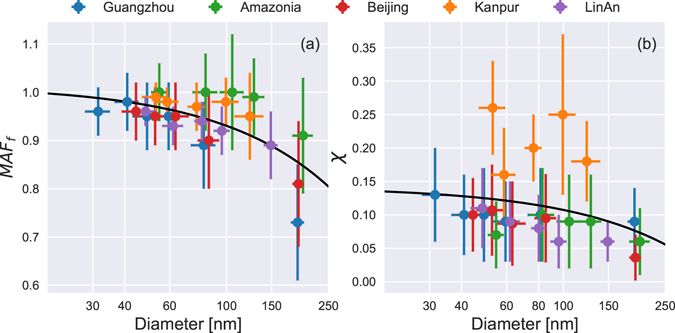
Figure 7.

Measured values of (a) MAFf and (b) χ plotted against the critical diameters of aerosol particles. The points are the mean values of the measurements and the error bars represent the standard deviations. The solid black line is the fitting line. The blue data are from Rose, Nowak11, the green data are from Gunthe, King33, the red data are from Gunthe, Rose36, the orange data are from Bhattu and Tripathi35, and the violet data are from the research reported here.
