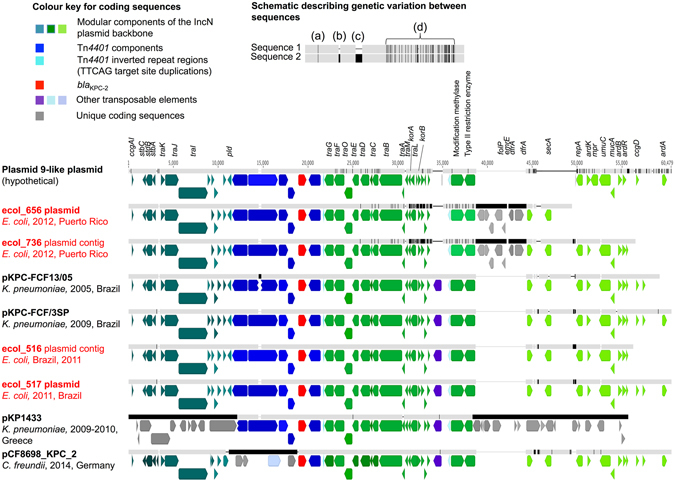
Figure 2.

Comparison schematic of FJ223607-like (Plasmid 9-like) IncN plasmids (publicly available; this study), and their geographic origin/dates of isolation. Plasmid sequence names in red are those from this study, derived from PacBio data and closed (ecol_517, ecol_656) or incomplete plasmid structures (ecol_516, ecol_736) derived from Illumina data. Aligned bars adjacent to plasmid names represent plasmid sequences: light grey denotes regions with 100% sequence identity; black represents nucleotide diversity between sequences; and thin lines represent indels. Coding sequences are represented by fat arrows below individual sequence bars and are colour-coded as per the colour key. The inset schematic describing genetic variation between sequences depicts examples of evolutionary events identified: (a) single nucleotide level change, (b) small indels (≤100 bp), (c) large indels (>100 bp), (d) recombination events.
