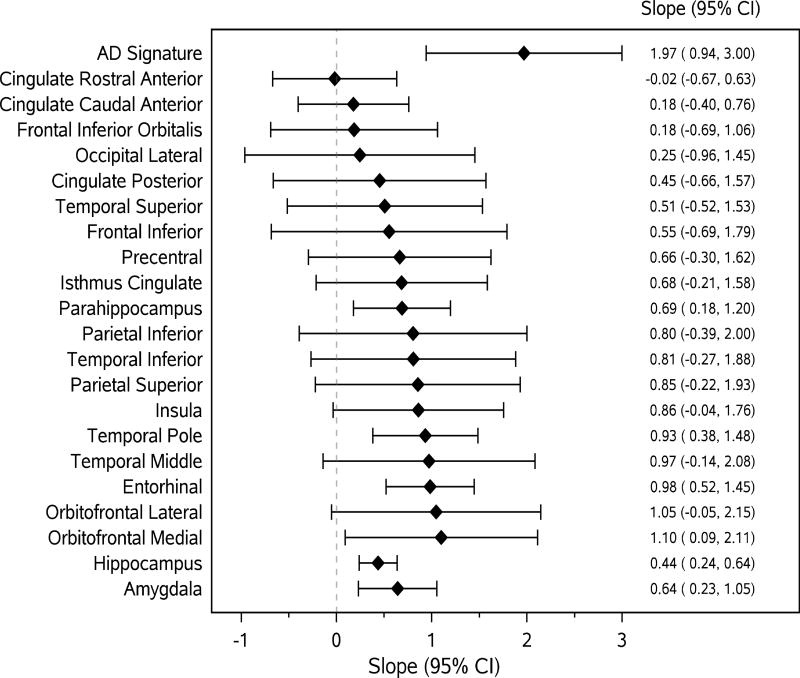
Figure 1.
Forest plots for associations (slopes, 95%CI) of continuous cortical thickness and volume measures (i.e., amygdala and hippocampus) with continuous B-SIT as the outcome variable. The diamonds represent slopes (estimated change in B-SIT per unit increase in cortical thickness (in mm) and volume measures (in cm3)) from general linear models adjusted for age, sex, education. The solid horizontal lines represent the 95% confidence intervals.
AD signature = an AD-signature cortical thickness measure was computed by averaging the cortical thickness for entorhinal, inferior temporal, middle temporal, and fusiform cortices.

