Fig. 3.

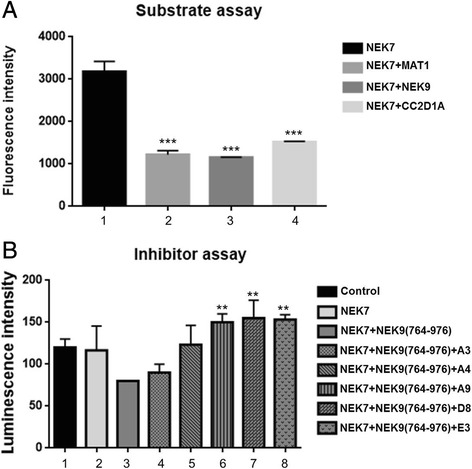
Luciferase assay as competitor in substrates and inhibitor screening assay. a NEK7 substrates testing through the competition assay luciferase activity. Graph represents the intensity of luminescence reactions were performed with NEK7 in the presence or absence of different protein substrates (NEK9 (764–976), Mat1(Full-length), CC2D1A (501–940) as indicated in the legend. (***) Indicates P < 0·05 calculated using one-Way ANOVA, Multiple comparison test (GraphPad Prism). b Test of NEK7 inhibitors by competition assay using red luciferase. All conditions contain 100 μM Luciferin, 1 μM luciferase, 1 μM ATP in Buffer pH 8.0, 0.8% DMSO (with or without the indicated inhibitors) and the proteins indicated in the figure [NEK7 with or without NEK9 (764–976)]. The graph represents the intensity of luminescence reactions made in the absence and presence of different NEK7 inhibitors as indicated in the legend. A3: ATM Kinase Inhibitor; A4: ATM / ATR Kinase Inhibitor; A9: Aminopurvanalol A; D8: GSK-3B Inhibitor VIII; E3: GSK-3 Inhibitor XIII. (**) Indicates P < 0·05 calculated using one-Way ANOVA in comparison with column 3 (max. ATP consumption), Multiple comparison test (GraphPad Prism)
