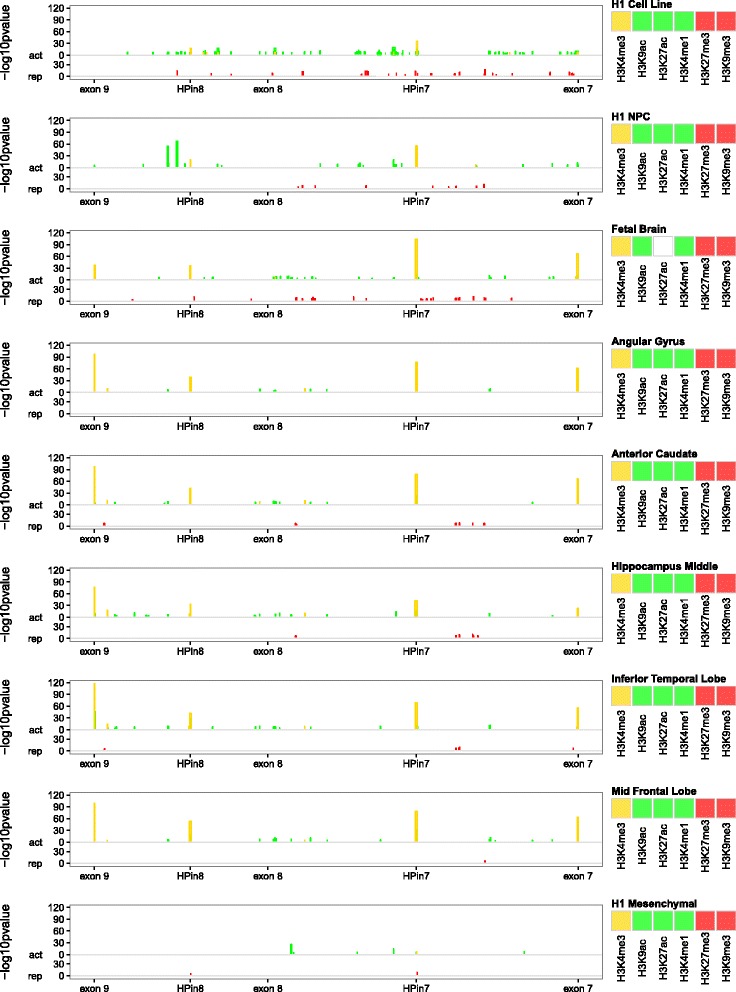
Fig. 2.

Discretized ChIP-Seq profile overview of different markers across different tissues or cell types. The data come from profile–control comparisons of Roadmap Epigenomics Project data using MACS v2.1.0. The y-axis reports the -log10p value as measurements of marker against control enrichments; the greater the height, the higher the statistical confidence. Each of the nine stacked plots reports a discretized ChIP-Seq profile for different markers in one specific tissue. Starting from the top we have stem cells (H1 cell line), neuronal progenitor cells (H1 derived neuronal progenitor cultured cells), fetal brain, adult brain tissues, and, at the bottom, one non-brain-related tissue, H1 derived mesenchymal stem cells. In each plot, histone modifications are grouped according to their related function: promoter marker (in gold), activation markers (“act”, in green) or repression markers (“rep”, in red). The same y scale is applied to the three groups. Exons 7, 8, and 9 along with HPin7 and HPin8 are reported on the x-axis. All markers are listed in the legend, mixed and overlapped in the plot. A white box in the marker legend means data are not available. All genomic coordinates are in hg19
