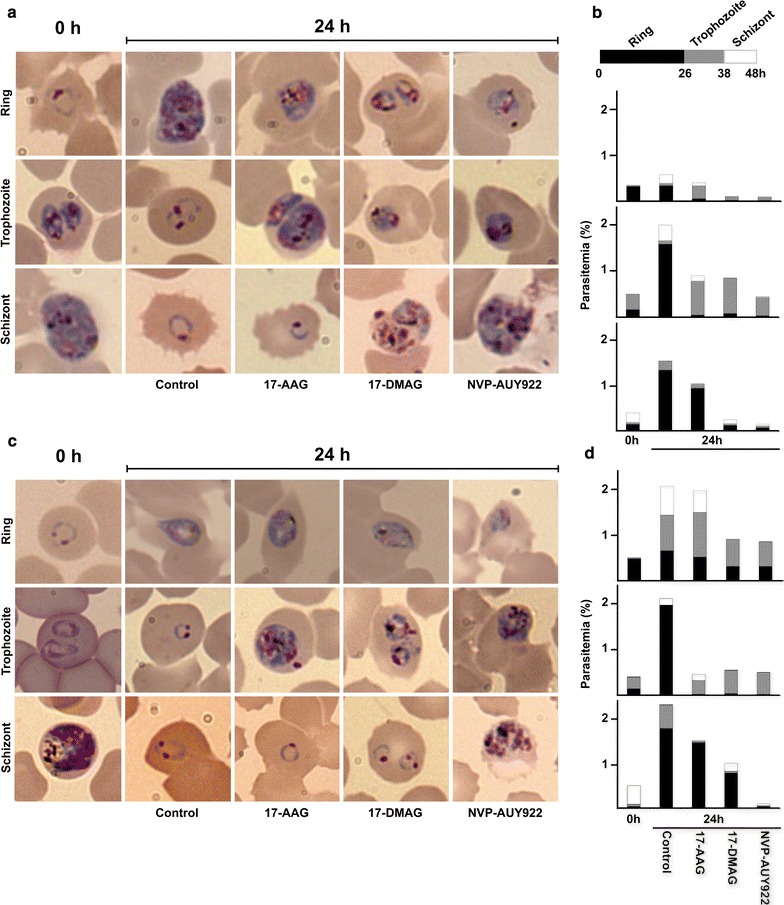
Fig. 3.

Morphology of P. falciparum 3D7 (a, b) and W2 (c, d) parasites exposed to different Hsp90 inhibitors. Ring, Trophozoite or Schizont synchronized cultures were exposed to three compounds 17-AAG (6 µM), 17-DMAG (1.2 µM) and NVP-AUY922 (0.72 µM) for 24 h. The time 0 h represents the starting point of the cultures, and each photo represent the most abundant parasite stage observed post exposure or control. For each culture 100 infected erythrocytes were counted; a bar graph indicates the parasitaemia, and different shades indicates the proportion of different parasite developmental stages (b, d). Photos of Giemsa stained thin films at ×100 magnification
