Figure 2.
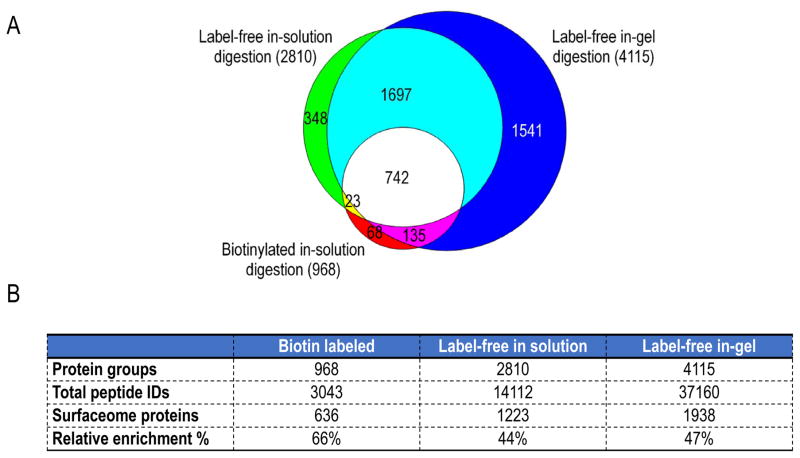
Comparison of three different surfaceome analysis workflows. (A) Area proportional Venn diagram depicting the overlap of all protein groups identified in the surfaceome isolated with three different methods: biotinylated in-solution digestion, label-free in-solution digestion and label-free in-gel digestion. (B) Absolute and relative numbers of cell surface annotated proteins identified and total numbers of peptides identified with the three different methods compared.

