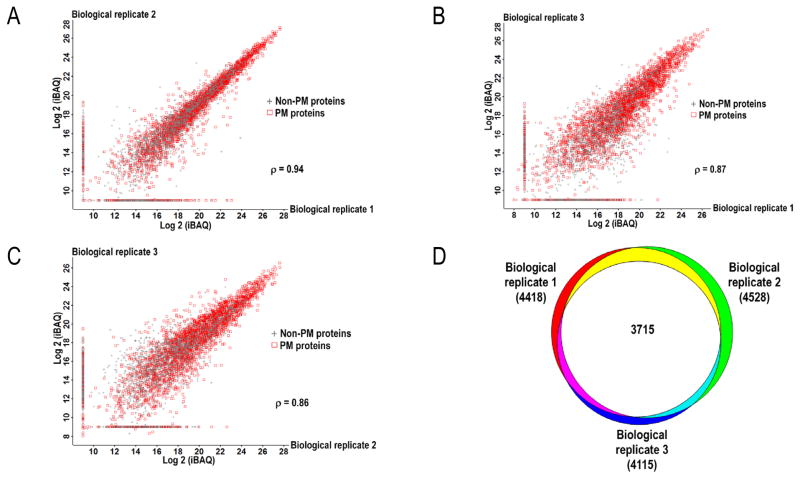
Figure 3.
(A–C) Biological reproducibility assessed by the calculated Pearson correlation coefficient (ρ) for each pairwise comparison between three biological replicates prepared and analyzed on different days from different batches of cells. MaxQuant Log2 (iBAQ) values present in one but absent in another pairwise comparison were given an arbitrary value of 9 for visualization purposes. (D) Venn diagram depicts the overlap in detected proteins between the biological replicates. PM, plasma membrane

