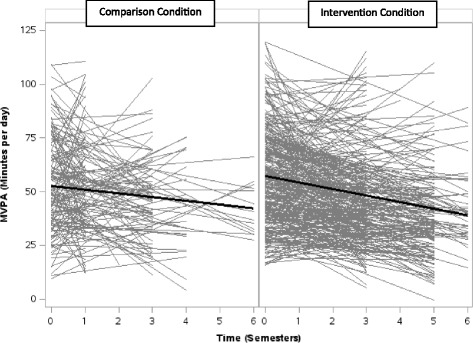
Fig. 4.

Results from Study 2 (accelerometer): Student MVPA trajectories from April 2008 to January 2012, by study condition. Linear regressions of MVPA (minutes per day) across semesters for each student with baseline and at least 1 valid follow-up measurement, by study condition, are shown in gray. Linear growth curves showing averaged baseline MVPA and averaged rate of change in MVPA among students, by study condition, are shown in black
