
Fig. 2.
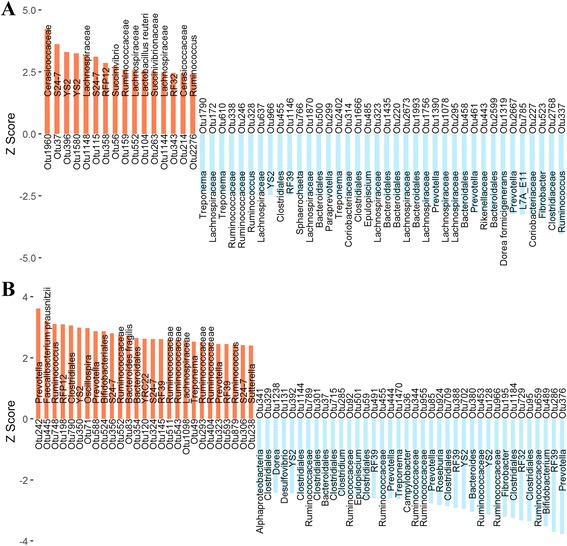
The IMF-associated OTUs. a The 54 IMF-associated OTUs identified in the cecum lumen samples (FDR < 0.1) are shown as Z score, the red bar corresponds to positive correlation and the blue bar corresponds to negative correlation, the text on the bar corresponds to microbial taxa annotated to the OTU. b The 65 IMF-associated OTUs identified in fecal samples (FDR < 0.1)