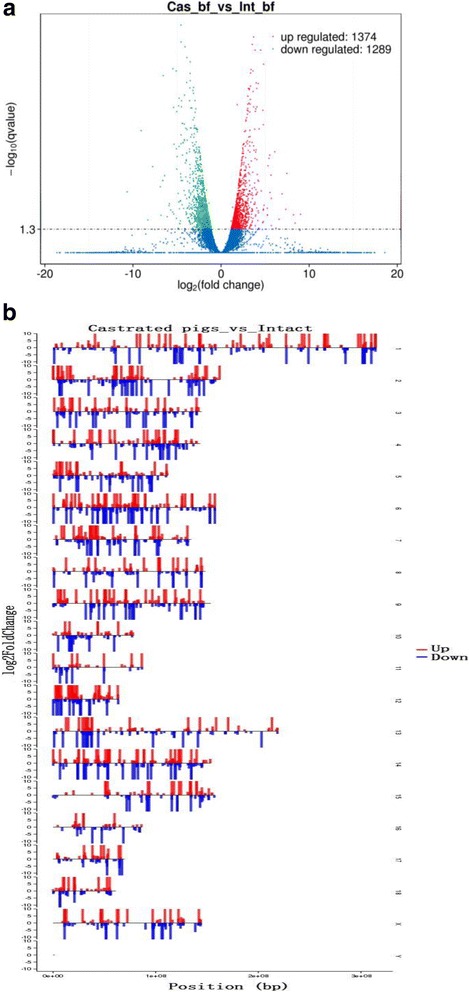
Fig. 2.

The differentially expressed lncRNAs and mRNA between castrated and intact male pigs and their distribution. a The differentially expressed lncRNAs and mRNA between castrated and intact male pigs. Each point in the figure represents a lncRNA or mRNA. The X axis show the position of lncRNAs and mRNA in different chromosomes, the Y axis show the log2FoldChange. The red points represent up-regulated lncRNAs or mRNA. The green points represent down-regulated lncRNAs or mRNA. The blue points represent equally expressed lncRNAs or mRNA. b The distribution of the differentially expressed lncRNAs and mRNA. The Y axis show log2normalized read counts. The red bars represent up-regulated lncRNAs or mRNA. The green bars represent down-regulated lncRNAs or mRNA
