
Fig. 3.
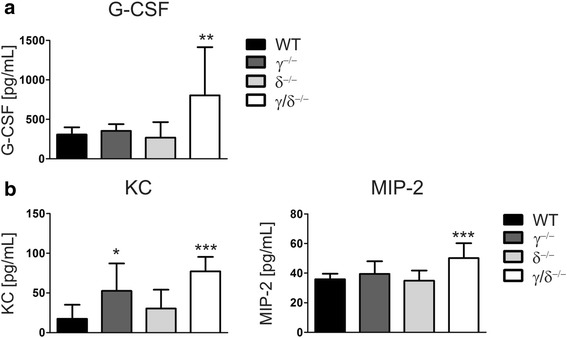
Serum concentrations of G-CSF and CXC chemokines are increased in p110γ/δ−/− mice. Cytokines were measured using a Bio-Plex assay. Concentrations of (a) G-CSF and (b) the CXC chemokines KC and MIP-2 in the serum of WT, p110γ−/−, p110δ−/−, and p110γ/δ−/− mice. Bars represent means + SD of n = 10 mice per group. Data were statistically analyzed as described in Fig. 1