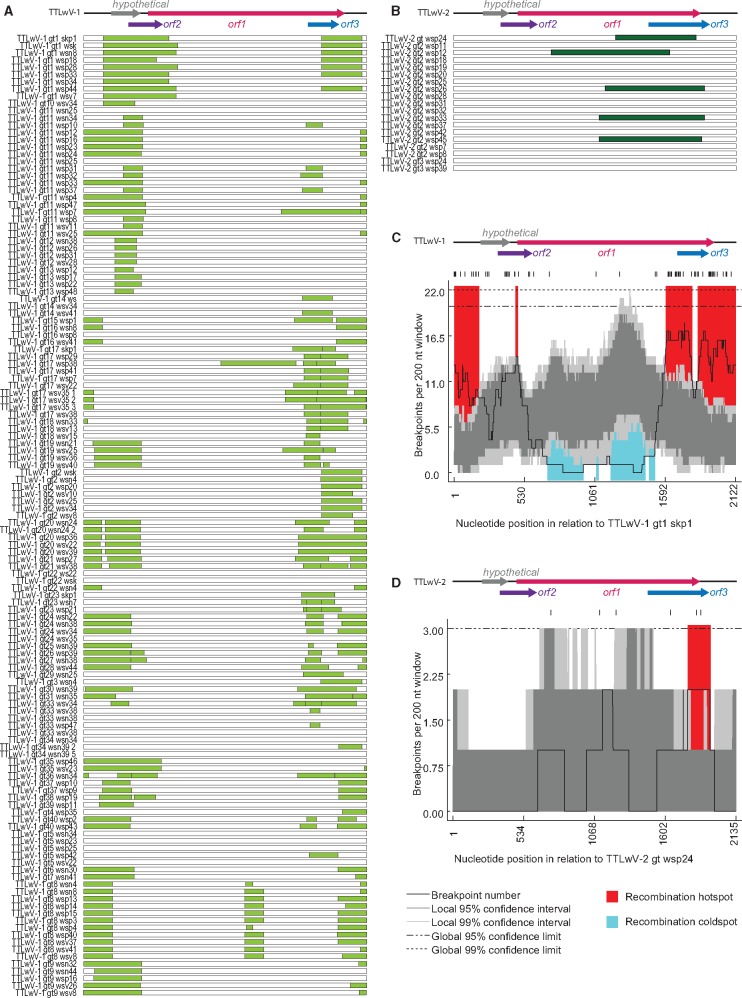
Figure 5.
Summary of recombinant regions identified in (A) TTLwV-1 (light green bars) and (B) TTLwV-2 (dark green bars). Recombination breakpoint distribution plots for (C) TTLwV-1 and (D) TTLwV-2, with breakpoint hot-spots indicated in red and cold-spots in blue. The dark and light grey areas of the plots indicate 95% and 99% confidence intervals, respectively. Detectable breakpoint positions are indicated by vertical lines at the top of the graphs. The thick black line represents the plot of the number of breakpoints detected within the 200-nt window region (window was moved along each of the represented alignments 1 nt at a time).

