
Figure 2.
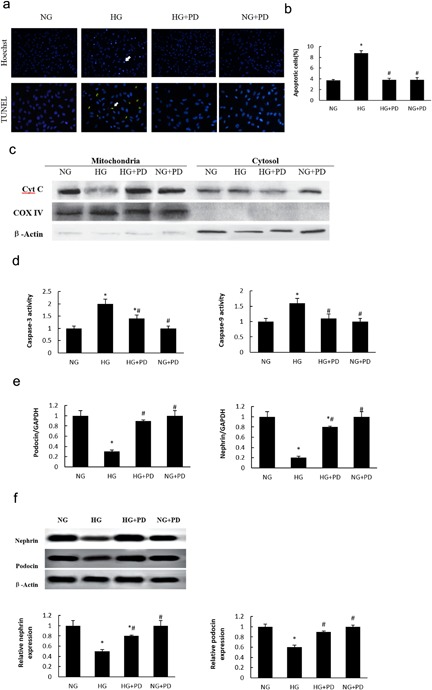
PD attenuated apoptosis on HG‐induced MPC5 cell. (a) Apoptosis measured by Hoechst 33258 staining and TUNEL staining (×200). (b) The quantitative determination of cell apoptosis using flow cytometry. (c) Western blot analysis of cytochrome C release. (d) Cleaved form of caspase‐3 and caspase‐9. (e) Changes in nephrin and podocin mRNA expression levels in hyperglycemic MPC5 cells. (f) Western blot analysis of nephrin and podocin. NG, MPC5 cells cultured in 5.3 mM glucose; HG, MPC5 cells cultured in 30 mM D‐glucose; HG + PD, MPC5 cells cultured in 30 mM glucose and 25 mM PD; NG + PD, MPC5 cells cultured in 5.3 mM glucose and 25 mM PD. The results are presented as the mean ± SE (n = 4; ≥100 cells were counted in three independent experiments). *p < 0.05 versus NG; #p < 0.05 versus HG