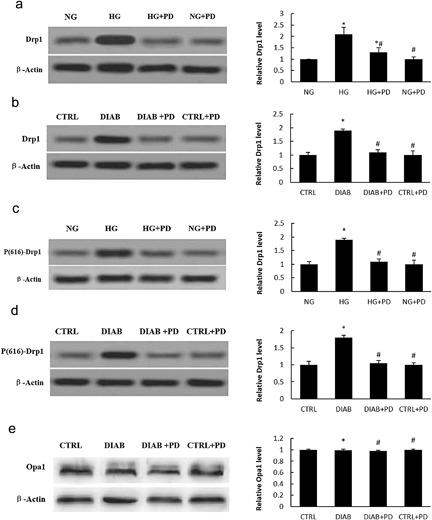
Figure 4.

PD inhibits Drp1 expression in HG‐induced podocytes. (a) Drp1 expression in MPC5 cells. (b) Drp1 expression in primary podocytes isolated from KKAy mice. (c) Active Drp1 (p‐Drp1) levels in MPC5 cells. (d) Active Drp1 (p‐Drp1) levels in primary podocytes isolated from KKAy mice. (e) Western blot analysis of Opa1 expression in isolated glomerular podocytes. NG, MPC5 cells cultured in 5.3 mM D‐glucose; HG, MPC5 cells cultured in 30 mM D‐glucose; HG + PD, MPC5 cells cultured in 30 mM D‐glucose and 25 mM PD; CTRL + PD, MPC5 cells cultured in 5.3 mM D‐glucose and 25 mM PD. CTRL, C57BL/6J mice treated with vehicle; DIAB, KKAy mice treated with vehicle; DIAB + PD, KKAy mice treated with PD; CTRL + PD, C57BL/6J mice treated with PD. The results are presented as the mean ± SE. *p < 0.05 versus CTRL(NG); #p < 0.05 versus HG(DIAB)
