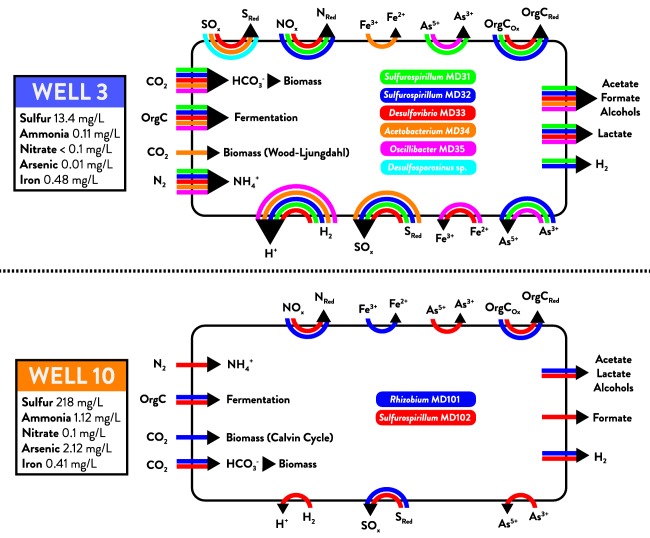
Figure 5.

Model of potential interactions and dependencies among populations in the microbial assemblages recovered from Well 3 and Well 10. The microbial community metagenome is represented by large black rectangles (Well 3 above, Well 10 below). Within each metagenome, genome bins are assigned to colors and predicted metabolic functions for each genome are represented by colored arrows between reactants and products. Predicted functions indicated at the top and bottom edges of the diagram represent reduction and oxidation reactions respectively. Arrows on the left edge include carbon and nitrogen fixation potential and predicted capacity for fermentative metabolism. Arrows on the right edge represent predicted fermentative byproducts that would be generated and potentially available for uptake by community members via an anaerobic food web. Measured fluid elemental concentrations for both wells are listed at left.
