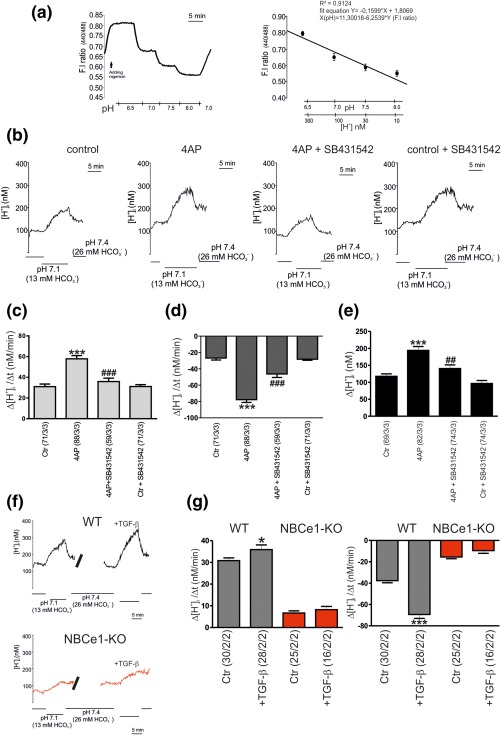
Figure 2.

Evaluation of NBCe1 transport activity. Calibration of the H+ ‐sensitive fluorescence signal in cultured cortical astrocytes. Calibration of the fluorescence intensity (F.I) 440/488 ratio signal in the presence of nigericin to equilibrate H+ across the cell membrane, monitored at different extracellular pH values, 6.5, 7.0, 7.5, 8.0, and plotted against the pH value and the respective H+ concentration. The coefficient of correlation (R2) and the fit equation are indicated in the plot. (b): Original recordings of intracellular [H+] ([H+]i) in cultured cortical astrocytes during reduction of external pH and [ ] from 7.4 and 26 mM to 7.1 and 13 mM, respectively, to challenge outwardly directed NBCe1 activity, before and after incubation with 4‐AP (100 µM, 20 min), in control, and in the presence of the TGF‐β receptor II inhibitor SB431542 (10 µM) (b–e). Bar plots of the rate of acidification (c), the rate of alkalinisation (d), and the amplitude (e) as measured upon changing external pH and [ ] to 7.1 and 13 mM, respectively, and back to pH 7.4 and 26 mM [ ]. (f): Original recordings of intracellular [H+] ([H+]i) in cultured cortical astrocytes from wild type (black; WT) and Slc4a4 deficient mice (red; NBCe1‐KO) during reduction of external pH and [ ] from 7.4 and 26 mM to 7.1 and 13 mM, respectively, before and after incubation with 2 ng/mL TGF‐β for 60 min. (g): Bar plots of the rate of acidification, and the rate of alkalinisation as measured upon changing external pH and [ ] to 7.1 and 13 mM, respectively, and back to pH 7.4 and 26 mM [ ]. *p < .05, ***p < .001, for the significant increase, compared to the untreated controls, using the Student's t‐test and ## p < .01, ### p < .001 for the significant decrease, compared to 4AP treatment, using one‐way ANOVA and Bonferroni post hoc test. The number of cells/cultures/animals used in the experiments is indicated
