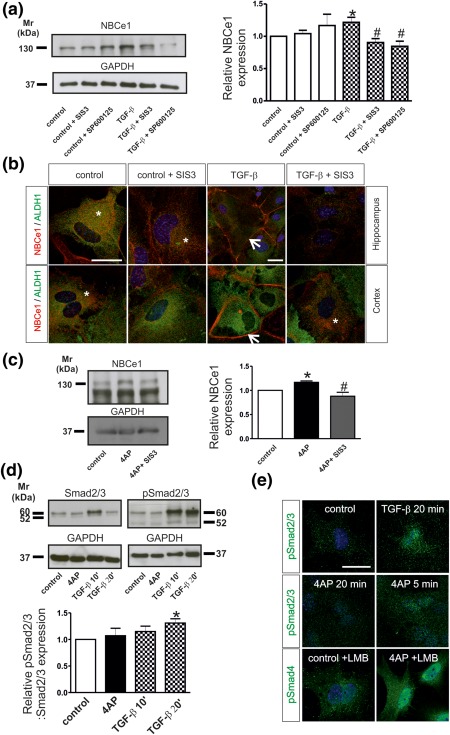
Figure 3.

(a) NBCe1 protein expression in primary cortical astrocytes following application of the inhibitor of Smad3 SIS3 (3 µM), or the inhibitor of JNK signaling, SP600125 (10 µM) in the presence or absence of recombinant TGF‐β (2 ng/mL). The blot is representative of four different experiments. Protein of 20 µg was loaded per lane. (b) Double immunofluorescence for NBCe1 and ALDH1 in primary hippocampal and cortical astrocytes. Arrows point to membrane NBCe1 and * indicates intracellular NBCe1 distribution. Scale bar: 25 µm (c) NBCe1 protein expression in cortical astrocytes after 4AP treatment in the presence of the inhibitor of Smad3 SIS3 (3 µM). The blot is representative of three different experiments. Protein 50 µg was loaded per lane. (d) Activation of canonical TGF‐β signaling in primary astrocytes. Immunoblotting for Smad2/3 and phosphorylated Smad2/3 (pSmad2/3) in control cortical astrocytes and following treatment with 100 µM AP for 20 min, or 2 ng/mL TGF‐β for 10 or 20 min. Protein of 10 µg was loaded per lane, n = 3. (*p < .05 for significant increase after densitometric analysis of the signal ratio NBCe1:GAPDH or ratio (pSmad2/3: GAPDH): (Smad2/3:GAPDH) and Student's t‐test, compared to controls, # p < .05 for significant decrease using one‐way ANOVA and Bonferroni post hoc test, compared to TGF‐β or 4AP treatment. (e) Immunofluorescence for pSmad2/3 in control cortical astrocytes and after treatment with 4AP for 5 min and 20 min or TGF‐β for 20 min. Immunofluorescence for pSmad4 in control astrocytes and after treatment with 4AP in the presence of the nuclear export inhibitor leptomycin B (LMB). Nuclei are stained with DAPI. Scale bar: 25 µm
