
Figure 5.
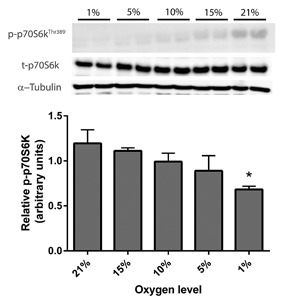
Phosphorylation of p70S6 kinase following 24 h of culture at various levels of hypoxia. Phosphorylated p70S6 kinase is normalized to the levels of total p70S6 kinase and α‐tubulin. Data are expressed as mean ± SEM for n = 4 engineered muscles. * indicates statistically different to 21% O2 (P ≤ 0.05). Note that the direction of the western blot is opposite to that of the representative graph.