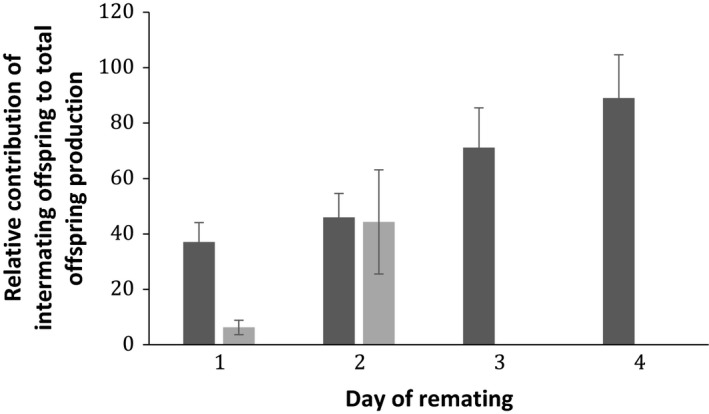
Figure 5.

For the comparison of SP‐lacking (SP 0, light grey) with SP‐transferring control males (SP +, dark grey), the relative proportion of the number of offspring produced in the intermating interval out of the total number of offspring produced, against day of remating, is depicted. The number of offspring from the intermating period represented a successively larger fraction of overall offspring production as males induced longer remating intervals (increasing day of remating).
