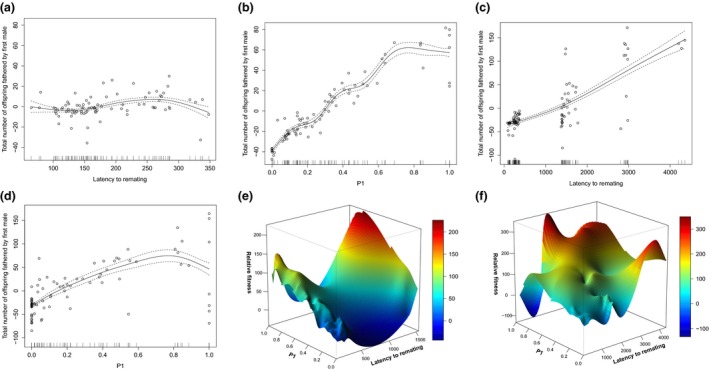
Figure 6.

SP + and SP 0 male fitness, latency to second mating and P1. Cubic splines to illustrate the relationship between fitness and male‐induced latency to remating (a) + (c) and male sperm defence (P1) success (b) + (d) for SP 0 (a, b) and SP + (c, d) males. Note the different scales on the fitness ordinates for the two male genotypes. Data points for seven females (of 94) remating on day two in the SP 0 treatment were excluded as they exerted undue leverage and forced the model to define an area of badly represented parameter space, with a large gap to the remaining 87 data points. Similarly, one data point for the SP + treatment was excluded, as the female did not remate within the 4 day window. 3D plots of the fitness landscape for (e) SP‐lacking (SP 0) and (f) SP‐transferring, genetically matched control (SP +) males. Displayed is the combined impact of the male‐induced length of the intermating interval and his sperm defence (P1) success on fitness. Fitness is measured as the total number of offspring produced by the focal male and is shown on the z‐axis. The height and colour of the landscape display the potential fitness gain resulting from the different combination of intermating interval and P1. The ruggedness in the surface for SP + control males for remating intervals longer than 2000 min should be interpreted with caution, as this part of the landscape was based on few data points (90% of females remated by day 3).
