
Figure 3.
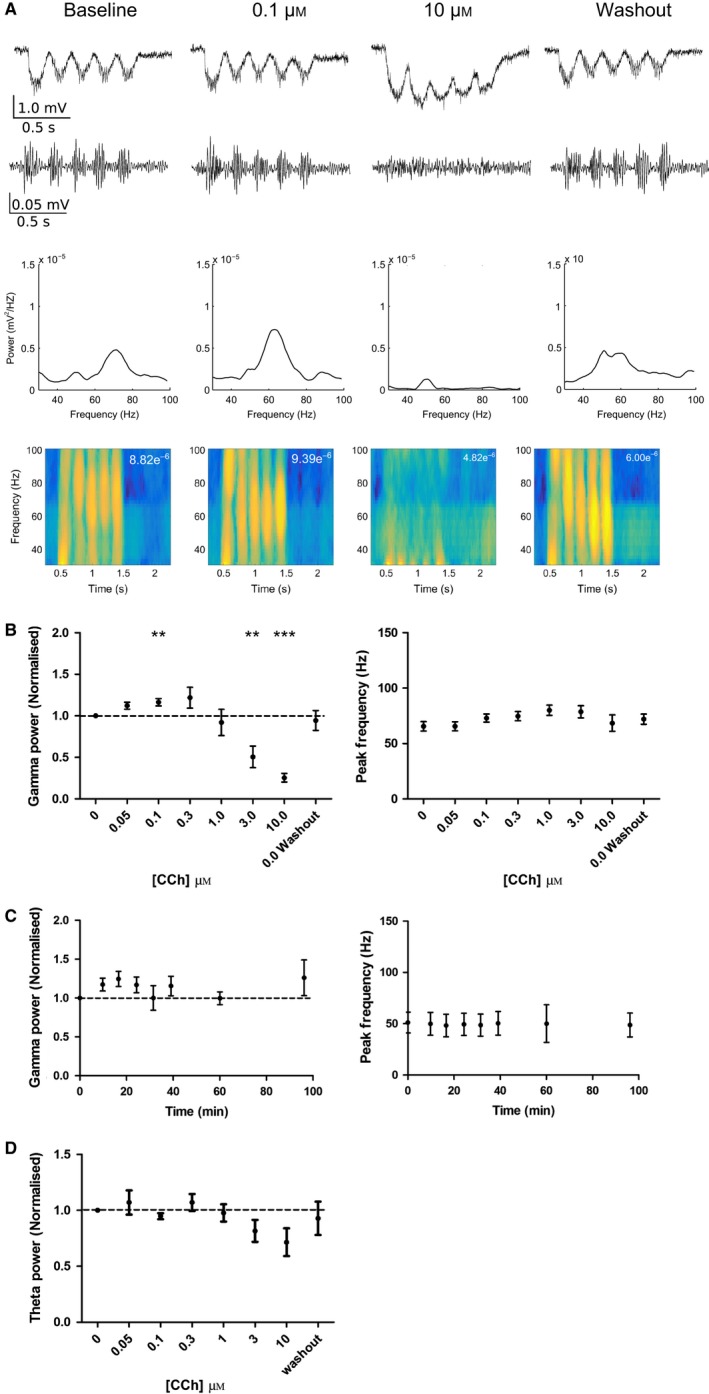
Carbachol induces a dose‐dependent bidirectional change in the power of theta‐nested gamma oscillations. (A) Example unfiltered (top) and bandpass filtered (2nd row) LFP traces showing response to 5 Hz sinusoidal light stimulation before, during and after carbachol (0.1 and 10 μm). Power spectral density plots and spectrograms (maximum power given in top right) are shown below for an example experiment. (B) Gamma oscillation power but not peak frequency was increased at low concentrations (0.1 μm) of carbachol but reduced at higher concentrations (3 and 10 μm) (n = 11 slices from nine animals; P = 0.00383, 0.00350 and 5.950 × 10⁻⁸ compared to baseline for 0.1, 3 and 10 μm, respectively, P > 0.05 for all other concentrations). (C) Gamma oscillation power and peak frequency were unchanged in time‐matched control experiments (n = 4 slices from three animals; P > 0.05 for all time points). (D) Theta oscillation power was not changed by any concentration of carbachol (n = 11 slices from nine animals; P > 0.05 for all concentrations). **P < 0.01, ***P < 0.001. [Colour figure can be viewed at wileyonlinelibrary.com].