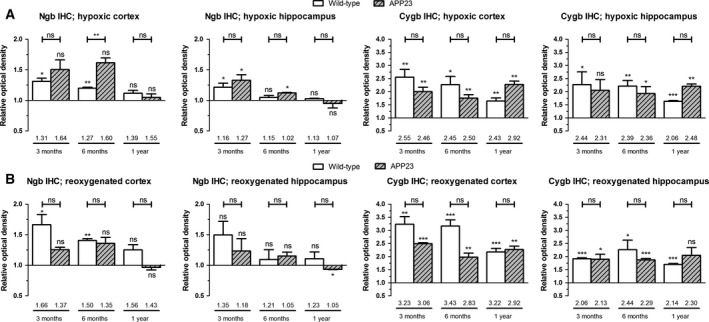
Figure 3.

Increased globin protein levels upon and after hypoxia in wild‐type and APP23 brain. Cortical and hippocampal protein (A,B) levels of murine Cygb and Ngb after (A) 48 h of hypoxia and (B) 48 h of hypoxia, followed by 6 h of reoxygenation. Data of wild‐type and APP23 mice (n ≥ 2 per group) are depicted as the mean ± SEM and represent values taken relative to the age/genotype‐matched normoxic condition. Numbers above horizontal bars represent mean values relative to the baseline, that is, the mean value of the cortex of the normoxic 3‐month‐old wild‐type mice. Significant differences compared to baseline values are defined as P < 0.05, according to Student's t‐test and depicted above rectangles. Other statistical significances were tested using one‐way ANOVA with Bonferroni post hoc test; *P < 0.05, **P < 0.01, ***P < 0.001.
