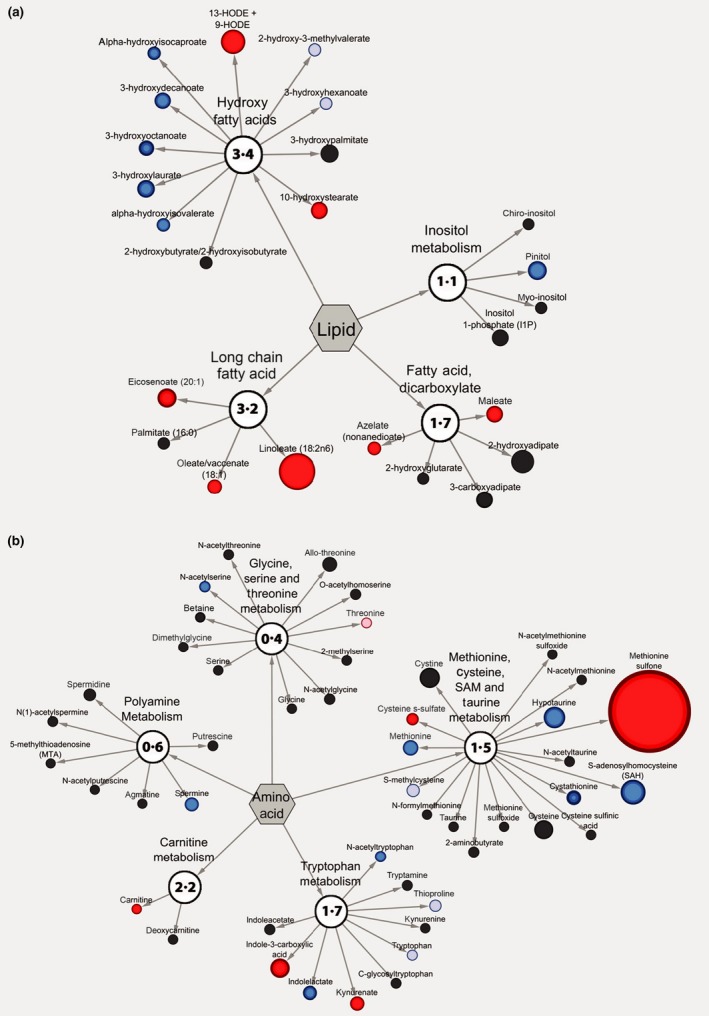
Figure 4.

Cytoscape visualization illustrates the metabolic pathways most differentially regulated between treatments. Cytoscape visualization of (a) lipid and (b) amino acid metabolic pathways that differ between LP and LP+RBE. For each metabolite, node diameter is proportional to the fold difference in LP+RBE compared to LP. Node colours indicate the direction of a metabolite's fold difference, where red indicates metabolites with a higher scaled abundance in LP+RBE (P < 0·05), blue indicates lower abundance in LP+RBE (P < 0·05), pink indicates trending higher in LP+RBE (0·05 < P < 0·10), and light blue indicates trending lower in LP+RBE (0·05 < P < 0·10). Black nodes indicate metabolites with fold differences that were not significantly altered between treatments. The pathway enrichment score is the number in the circles for each subclassification.
