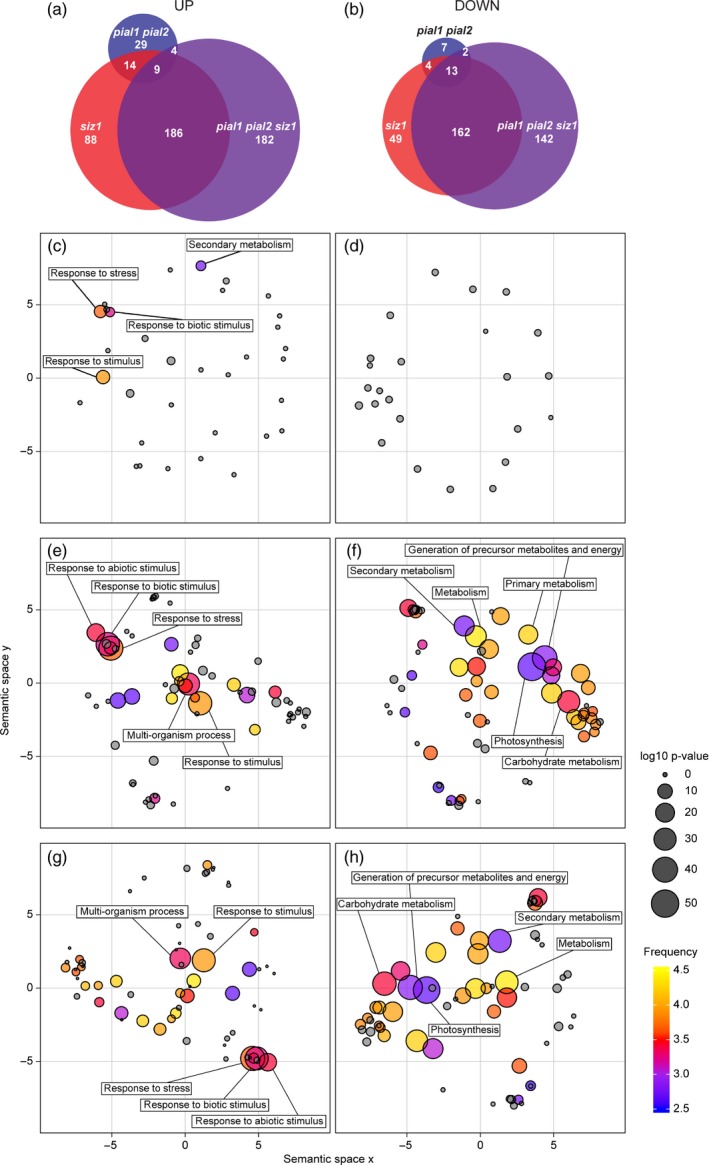
Figure 3.

Graphic display of up‐ and downregulated proteins grouped via Gene Ontology (GO) terms.
(a) Upregulated and (b) downregulated proteins in different backgrounds in a Venn diagram. Left lower panels, upregulated proteins in pial1 pial2 (c), siz1 (e), and in pial1 pial2 siz1 (g) mutants compared with the wild type. Right lower panels, downregulated proteins in pial1 pial2 (d), siz1 (f) and in pial1 pial2 siz1 (h) mutants compared with the wild type. The analysis includes all significantly changed proteins (anova, P < 0.05) with an abundance change of at least 50% when compared with the wild type. The size of the dots indicates the significance level (false discovery rate). The color code displays the number of Arabidopsis genes summarized under a particular GO term (frequent terms in yellow, rare terms in blue, logarithmic scale). Gray is used for GO terms not enriched above the chosen significance level (P > 0.01). For details, see Experimental Procedures, Figure S2 and Table S4.
