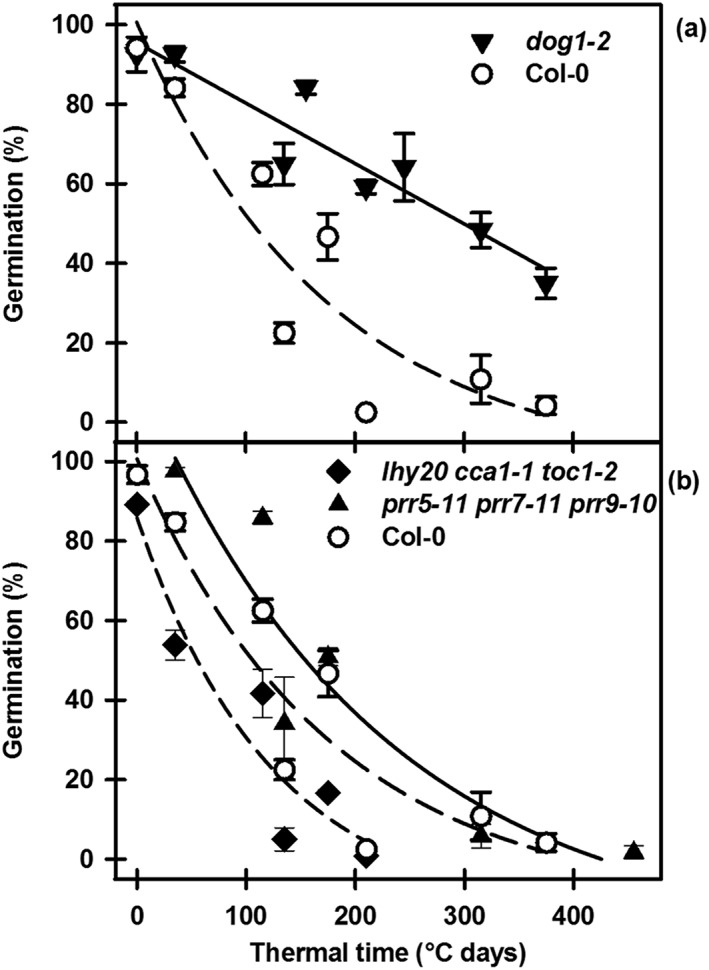
Figure 5.

Thermal time analysis of dormancy induction at high temperature following low‐temperature conditioning. (a) Wild type (Col‐0) and the dormancy mutant, dog1‐2, and (b) wild type (Col‐0) and the circadian clock mutants, lhy20 cca1‐1 toc1‐2 and prr5‐11 prr7‐11 prr9‐10. Data from Figs 3, S1 and S2 are replotted against thermal time (sum of temperature above 0 °C) for secondary dormancy induction at 20, 25 and 30 °C. The response to thermal time fits the following relationships: exponential decay (three parameters) regressions describe Col‐0 (R 2 = 0.972), lhy20 cca1‐1 toc1‐2 (R 2 = 0.897) and prr5‐11 prr7‐11 prr9‐10 (R 2 = 0.860), while a linear regression describes dog1‐2 (R = 0.928). The same data for Col‐0 appear in (a) and (b).
