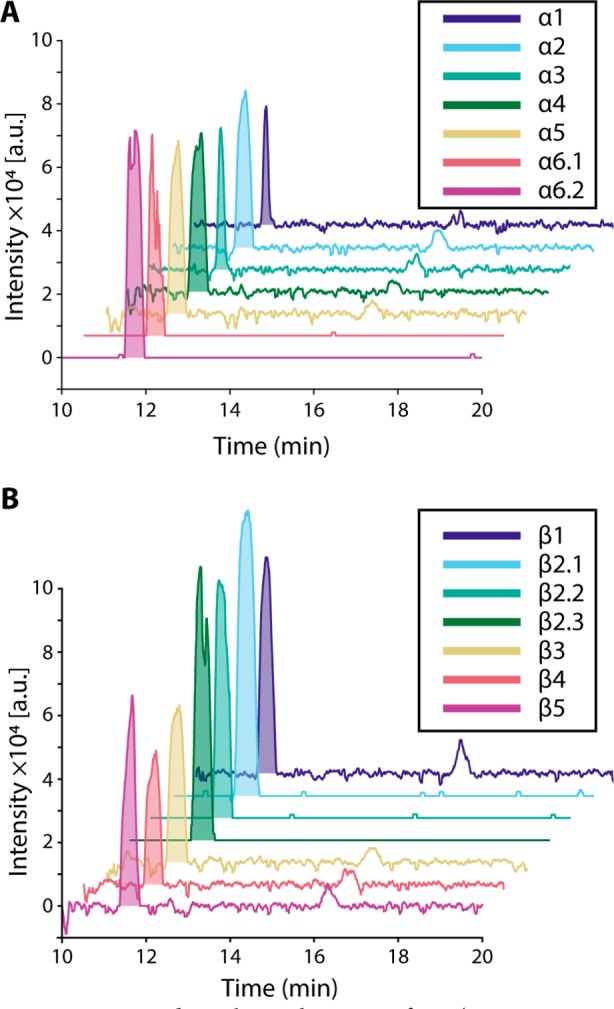
Figure 6.

Extracted ion electropherograms for m/z 154.09 ± 0.01. The peak with m/z and migration time matching dopamine standard is shaded in each electropherogram: (A) α cells; (B) β cells. Dopamine was detectable in every cell analyzed. The peak at ∼16 min is attributed to sodiated leucine. Single-cell samples analyzed with technical replicates are annotated with decimals, e.g., α6.1.
