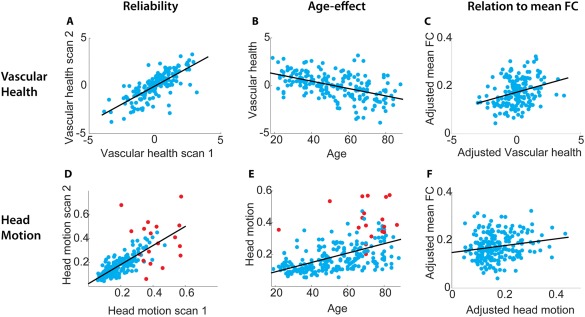
Figure 2.

Scatterplots of the associations between (A) age and vascular health (scan 1), (B) vascular health in scans 1 and 2 (reliability), (C) vascular health and mean functional connectivity (FC), adjusted for effect of age, (D) age and head motion (scan 1), (E) head motion in scans 1 and 2, (F) head motion and mean FC, adjusted for effect of age. Red dots in the plots with head motion indicate the participants who were excluded from the functional connectivity analyses due to the high number of spikes removed by wavelet despiking.
