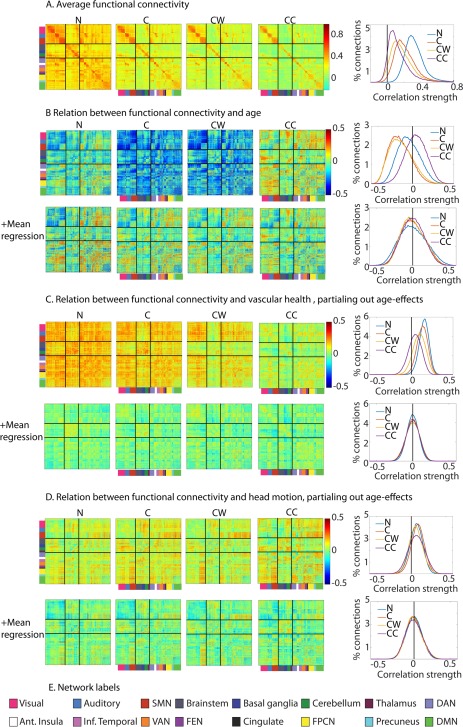
Figure 3.

Comparison of different nuisance regression options. (A) Average functional connectivity across participants ROIs are ordered by functional network, as indicated by the colors on the left side and bottom of the functional connectivity matrices, based on Geerligs et al. [2015b]. The network labels are shown below, in panel E. The solid black lines differentiate sensorimotor networks (top), subcortical networks (middle), and higher cortical networks (top). The histograms show the distributions of the effects in the figures on the left. (B) Relation between age and functional connectivity. (C) Relation between vascular health and functional connectivity, after adjusting for effects of age. (D) Relation between head motion and functional connectivity, after adjusting for effects of age. (E) Network labels. SMN = somato‐motor network (SMN), DAN = dorsal attention network, VAN = ventral attention network, FEN = fronto‐executive network, FPCN = fronto‐parietal control network, DMN= default mode network, Ant = anterior, Inf.=inferior. N = only motion regressors; C = motion regressors + CSF regressors; CW= motion regressors + CSF regressors + white matter regressors; CC = motion regressors +CompCor CSF and WM regressors.
