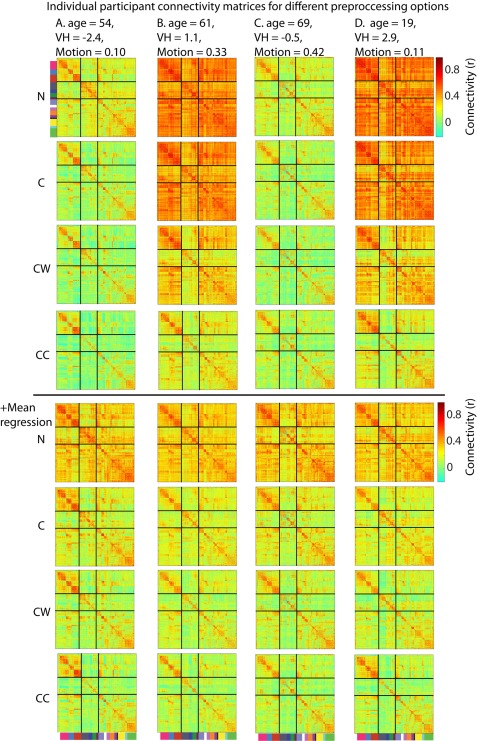
Figure 4.

(A–D) Connectivity estimates across pre‐processing options for individual participants who vary in their age, vascular health and head motion. Participants B and D have relatively high vascular health estimates, while participants A and C have relatively low vascular health. Participants A and D have relatively high levels of head motion, while participants B and C have low levels of head motion. N = only motion regressors; C = motion regressors + CSF regressors; CW= motion regressors + CSF regressors + white matter regressors; CC = motion regressors +CompCor CSF and WM regressors.
