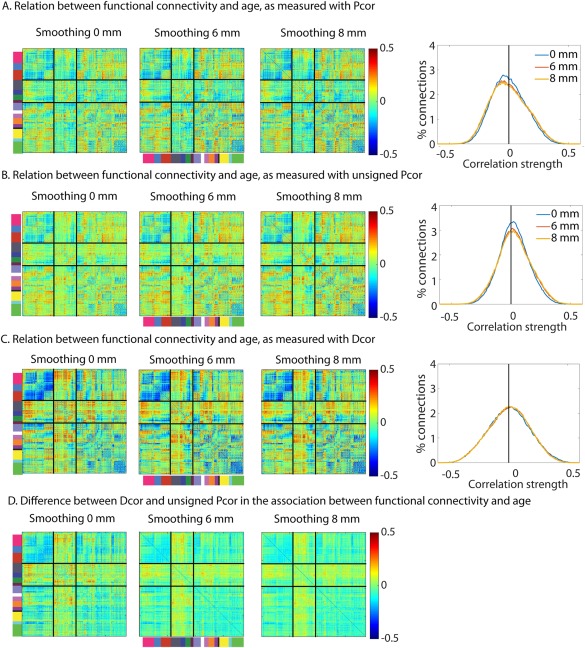
Figure 10.

Association between age and functional connectivity for different amounts of smoothing (left to right 0 mm, 6 mm and 8 mm) and various connectivity measures (A) Pcor, (B) unsigned Pcor (C) Dcor. (D) The difference in the association between age and functional connectivity between Dcor and unsigned Pcor. Pcor = Pearson correlation; Dcor = distance correlation; abs Pcor = absolute/unsigned Pearson correlation.
