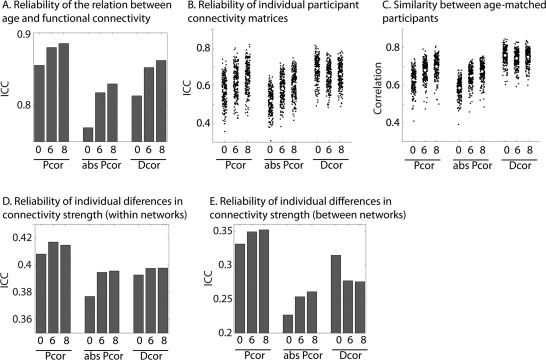
Figure 11.

Reliability and between participant similarity for Pcor, Dcor, and unsigned (absolute value, abs) Pcor connectivity matrices with different levels of smoothing. (A) Reliability of the age‐connectivity matrices (B) Reliability of each participants connectivity matrix (C) Similarity between age‐matched participants (D) Reliability of individual differences in connectivity strength, averaged across all within network connections. (E) Reliability of individual differences in connectivity strength, averaged across all between network connections. Pcor = Pearson correlation; Dcor = distance correlation; abs Pcor = absolute/unsigned Pearson correlation. 0, 6, and 8 refer to the mm of smoothing that was applied to the data.
