
Figure 12.
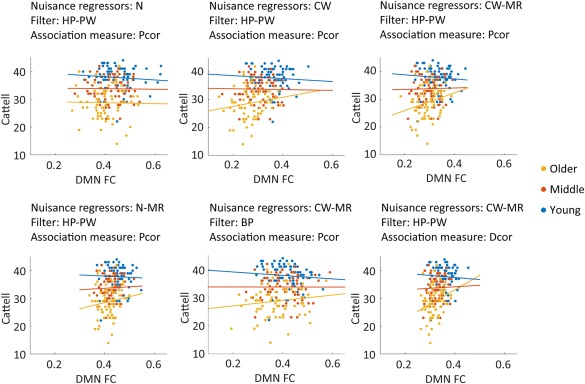
Association between DMN connectivity and performance on the Cattell task of fluid intelligence. Participants were split up into the youngest, middle and oldest third. Connectivity values were based on 8 mm smoothed data. The other nuisance regression and filtering options, as well as the choice of association measure are indicated on the top of each figure. N = only motion regressors; CW= motion regressors + CSF regressors + white matter regressors; HP = high pass filter; BP = band pass filter; PW = pre‐whitening. Pcor = Pearson correlation; Dcor = Distance correlation; MR = mean regression.