Figure 3.

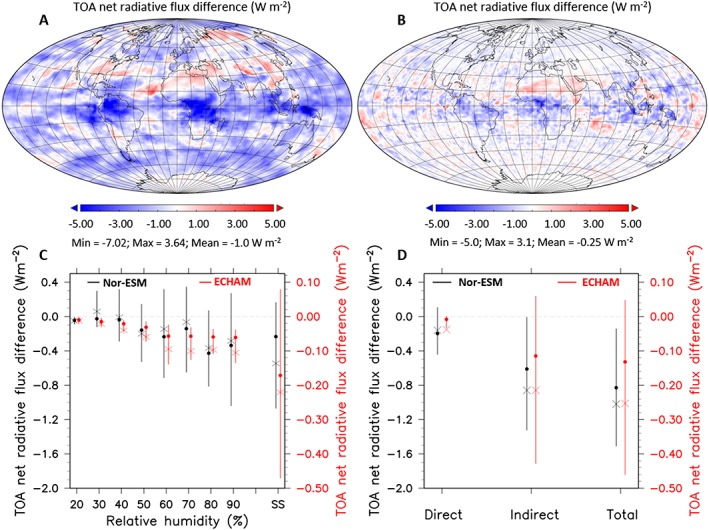
Sensitivities of two CMIP5 climate models to κ OA. (a) Difference in the top‐of‐the‐atmosphere (TOA) radiative flux in NorESM model simulations of the present‐day atmosphere (22 years simulated) for κ OA varying between 0.05 and 0.15 (see SI). (b) Difference in the top‐of‐the‐atmosphere radiative flux in the ECHAM6‐HAM2 model simulations (7 years simulated) of the present‐day atmosphere for κ OA varying between 0.05 and 0.15 (see SI). (c) TOA radiative flux difference for κ OA varying between 0.05 and 0.15 as a function of RH for NorESM (left axis, black symbols) and ECHAM (right axis, red symbols). Only grid points over land and outside of the polar regions have been considered. (d) The contribution of the direct versus indirect aerosol effects to the model sensitivity for NorESM (left axis, black symbols) and ECHAM (right axis, red symbols). Crosses refer to mean and dots to median values.
