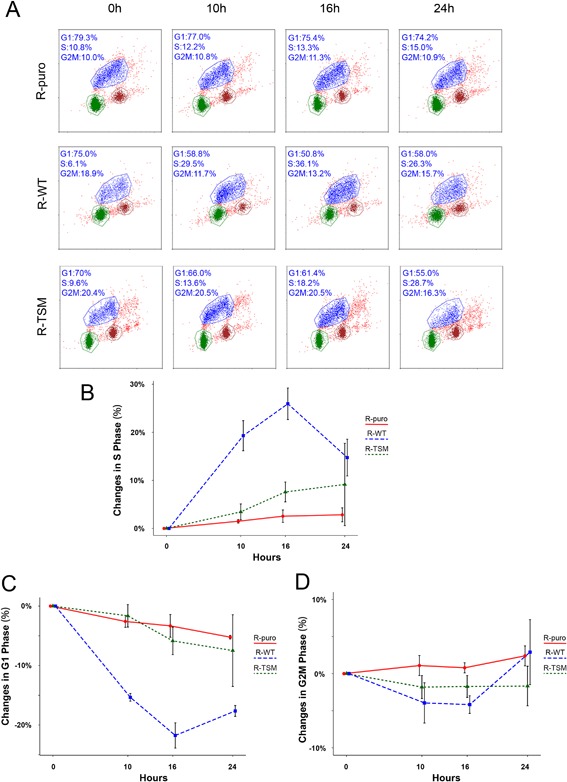
Figure 3.

Comparison of ligand stimulated cell cycle progression. (A) R‐puro, R‐WT, and R‐TSM were synchronized by 36 hr serum starvation and then exposed to 50 ng/ml IGF‐1 for 0, 10, 16, and 24 hr. FACS analyses after double staining with 7‐amino actinomycin D (X‐axis) and BrdU (Y‐axis) are shown. (B–D) Percentage of changes of number of cells in S‐ (B), G1‐ (C), and G2M‐phase (D) upon IGF‐1 stimulation for 10, 16, and 24 hr as compared to unstimulated cells (0 hr). Experiments on R‐puro, R‐WT, and R‐TSM were performed as described in A. Results represent means of three independent experiments. Whiskers represent 95% confidence intervals
