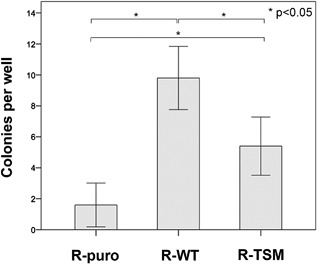
Figure 5.

Comparison of colony formation. Soft agar colony formation assay on R‐puro, R‐WT, and R‐TSM was performed as described in Materials and Methods. Experiments were stopped after 14 days for counting of colonies. Each column represents the mean number of colonies formed per well (total 5‐wells per cell line and experiment). Whiskers represent 95% confidence intervals. p‐values are indicated. Data are representative of three experiments
