
Figure 4.
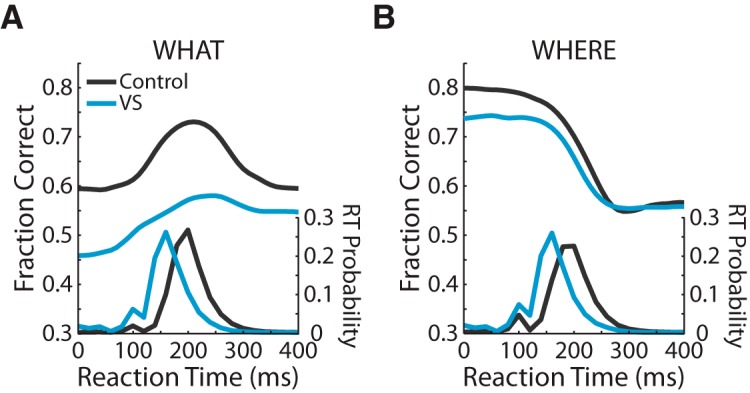
Speed–accuracy tradeoff. A, On the left axis, the fraction of correct choices is plotted as a function of choice RT for both the VS lesion and the control groups in What blocks. On the right axis, choice RT distributions for both groups in What blocks. B, Same as A, but for Where blocks.