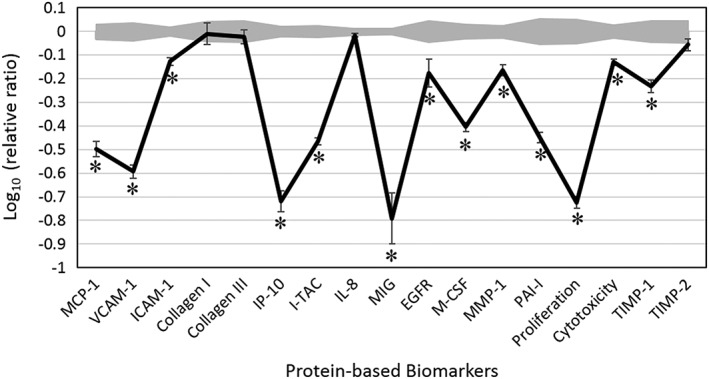
Figure 1.

The bioactivity profile of cinnamon bark essential oil (0.0012% v/v) in the human dermal fibroblast system HDF3CGF. The x‐axis denotes protein‐based biomarker readouts. The y‐axis denotes the relative expression levels of biomarkers when compared with the values for the vehicle control in log form. Vehicle control values are marked in gray at a 95% confidence level. * indicates a biomarker designated as having ‘key activity’, which is when a biomarker value is significantly different (p < 0.01) from the respective value for the vehicle control at a studied concentration, with an effect size of at least 20% (more than 0.1 log ratio units). MCP‐1, monocyte chemoattractant protein; VCAM‐1, vascular cell adhesion molecule 1; ICAM‐1, intracellular cell adhesion molecule 1; IP‐10, interferon gamma‐induced protein 10; I‐TAC, interferon‐inducible T‐cell alpha chemoattractant; IL‐8, interleukin‐8; MIG, the monokine induced by gamma interferon; EGFR, epidermal growth factor receptor; M‐CSF, macrophage colony‐stimulating factor; MMP‐1, matrix metalloproteinase 1; PAI‐1, plasminogen activator inhibitor 1; TIMP, tissue inhibitor of metalloproteinase.
